GleeYM Inc. offers quantitative cost and schedule risk analysis for small, medium, and large mega-complex capital projects. The Quantitative Risk Analysis (QRA) helps to determine probabilistic completion date and cash flows (PCF).
The Quantitative Schedule Risk Analysis (QSRA) focuses on uncertainty and risks that affect the overall schedule, i.e., activity durations and completion dates. SRA starts with reviewing the project schedule and performing schedule quality checks as specified by DCMA 14 points.
Perform Quantitative Cost Risk Analysis!
The Quantitative Cost Risk Analysis (QCRA) is performed on project financials and cost estimates using Monte Carlo Simulation (MCS). Cost is the main driver for making decisions. It’s the key factor that makes the management happy or unhappy. Business is all about monetary benefits.
Integrated Risk Analysis (IRA)!
Integrated Cost and Schedule Risk Analysis (IRA) is performed on Level - I or Level - II or Level-III schedule loaded with time-phased cost estimates. Cost and schedule risk analysis is performed using Monte Carlo simulation (MCS). cost and schedule risks are linked to activities. Activities are correlated to avoid merge bias. It is important to re-run the simulation and visualize the result.
Net Present Value (NPV)!
Net Present Value (NPA) analysis for a project and product. Perform what-if analysis by varying the inputs. Compare NPV results by analyzing the different scenarios for making decision under uncertainty. Also, perform a financial risk analysis
Quantitative Risk Analysis (QRA), Decision Making Under Uncertainty
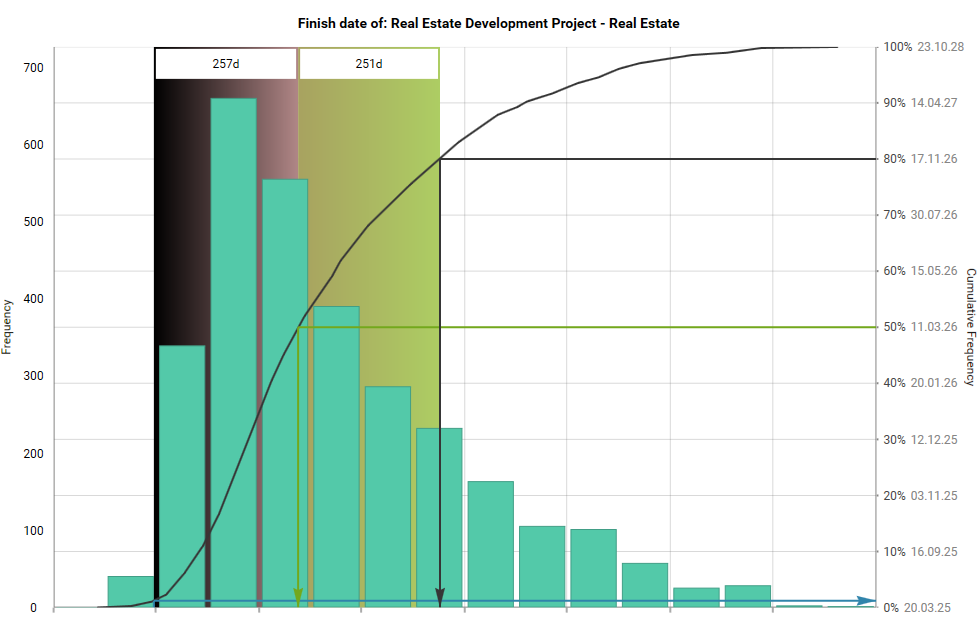
A schedule risk analysis (SRA) uses a risk-based project schedule (derived from the master schedule) to apply statistical techniques to envisage a level of confidence in meeting a project’s completion date. The analysis focuses on uncertainty and risks that affect the overall schedule, i.e., activity durations and completion dates. SRA starts with reviewing the project schedule and performing schedule quality checks as specified by DCMA 14 points.
Schedule risk analysis (SRA) helps to analyze the uncertainty in the project schedule using Monte Carlo Simulation. Deterministic schedule duration and finish date don’t provide enough information to answer flowing questions:
What is the probability of completing the project on the target date?
What if the predecessor of an activity finishes late?
What is the eighty (80%) chance of finishing the project?
SCR scope is:
Schedule Risk Analysis (SRA) to analyze uncertainty.
Correlating the activities
Probabilistic Branching
Quantitative Schedule Risk Analysis (QSRA)
Do you want to implement risk analysis/management software? click following link for details:
Project Schedule Quality Check for Schedule Risk Analysis
There can be several other parameters that can contribute to quality SRA. Like:
Contains all the activities that are necessary for the SRA.
There is a difference between a “Master Schedule” and a Schedule for risk analysis.
All activities should be linked together.
The sequence of activities plays an important role. Improper sequence of activities is one of the causes of conflicts in major complex projects.
Get the buy-in from all the key stakeholders.
Specify the assumptions and analyze the assumption during the simulation. Specify the uncertainties for each activity i.e. min. most likely and the max. Avoid heuristic estimates.
Try to get rid of “Cognitive Bias”. Although it is difficult. The support from top executives may help.
Depending upon the level of schedule. It takes days or weeks or even months to develop a schedule. There is no magic to perform SRA and visualize the data in seconds. Need to perform SRA several times with different scenarios to compare results.
Overlay results to analyze and visualize the difference between various outputs by varying the input data.
Uncertainties may cover lack of knowledge activity duration estimation error, resource availability, organizational culture, internal and external factors, market conditions, political scenario, project execution methodology, resource availability, productivity, project constraints, technology constraints, Biased opinion, known – Known and even unknown – unknown (This scenario should be analyzed separately to understand the impact), etc.
QSRA
QCRA
Integrated Cost and Schedule Risk Analysis (IRA)
Integrated Cost and Schedule Risk Analysis (IRA) is performed on schedule level – I, Level – II and Level -III loaded with time phased cost estimates.
Aligning resources to remain competitive and meeting strategic goals are cumbersome in this era of “Digital Transformation”. Digital transformation is reshaping the corporate world. Pursuing the digitizing requires a sense of urgency, change management agents, and the ability to choose the optimal decision based on the data. Decision making requires Data as input and presenting data in the form of alternatives/options to select the best one i.e. Risk-Based Decision Making.
In the concept phase, the project initial phase, presenting alternatives and choosing the best one is the key to success. Collecting data, reshaping the data, defining correlation and keeping eye on key risk drivers certainly helps to come to a conclusion and get buy-in from the key stakeholders. Presenting numbers/analytics to board members or partners are always a “Game Changer” to win.
Decision Tree Analysis helps to portray various decisions with data. Decision Tree infused with Date helps to determine optimal path and display combination of inputs for the corresponding output. It helps to better understand the uncertainties associated with the data and perform further analysis as per requirement for decision making.
JCL for Cost and Schedule
Industry
Offer services to identify risks and perform Quantitative Schedule Risk Analysis (QSRA) and Quantitative Cost Risk Analysis (QCRA) for mega complex projects in industries like
GleeYM Inc. have an experience of managing projects, program and portfolio Management ranging from $ 100 K to $ 10 B. Deployed system and implemented software. Experience with developing quantitative schedule and cost risk analysis. Facilitated dozens of risk workshops. Moreover, performing advanced risk modelling for what-if analysis using spreadsheets, etc.
Yes. We are well versed in developing risk models using excel and then perform quantitative risk analysis using Monte Carlo simulation (MCS). We have an extensive experience with @Risk. However, we are open to use Risk software as per client’s demand.