Decisive Decision Making for Digital Risk Management (DRM) – A Headway to Digital Transformation
Digital Transformation
Aligning resources to remain competitive and meeting strategic goals are cumbersome in this era of “Digital Transformation”. Digital transformation is reshaping the corporate world. Pursuing the digitizing requires a sense of urgency, change management agents, and the ability to choose the optimal decision based on the data. Decision making requires Data as input and presenting data in the form of alternatives/options to select the best one i.e. Risk-Based Decision Making.
In the concept phase, the project initial phase, presenting alternatives and choosing the best one is the key to success. Collecting data, reshaping the data, defining correlation and keeping eye on key risk drivers certainly helps to come to a conclusion and get buy-in from the key stakeholders. Presenting numbers/analytics to board members or partners are always a “Game Changer” to win.
Decision Tree Analysishelps to portray various decisions with data. Decision Tree infused withDate helps to determine optimal path and display combination of inputs for the corresponding output. It helps to better understand the uncertainties associated with the data and perform further analysis as per requirement for decision making.
Case Study: Digital Risk Management
SVP Technical decided to align projects with strategic goals and section of projects as per scorecard or set criteria. He chose SharePoint for an Enterprise solution. SharePoint is a masterpiece for collaboration and share information among the various Stakeholder. SharePoint is a content repository. His idea was based on an Enterprise solution. He presented this idea to the board members for final approval.
During the formal discussion, one prominent and dominant board member and the main investor asked him questions:
1- What if Enterprise deployment fails?
2- What if consider deployment first for Megaprojects only?
This could be the “Show Stopper” to get the final approval and budget allocation. Meeting adjourned with remarks/decision to present the idea again with best possible alternatives and answers these two questions to make the most of it.
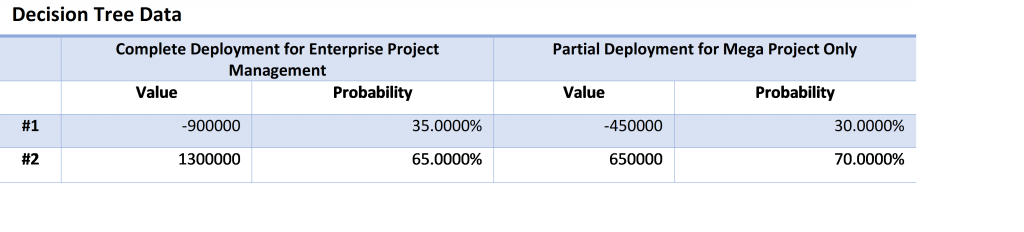
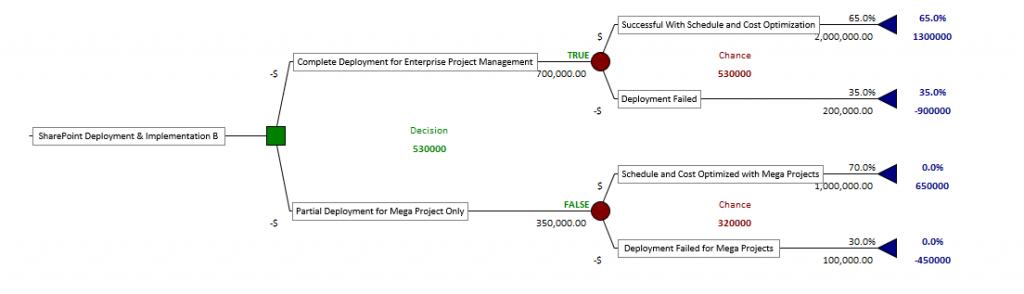
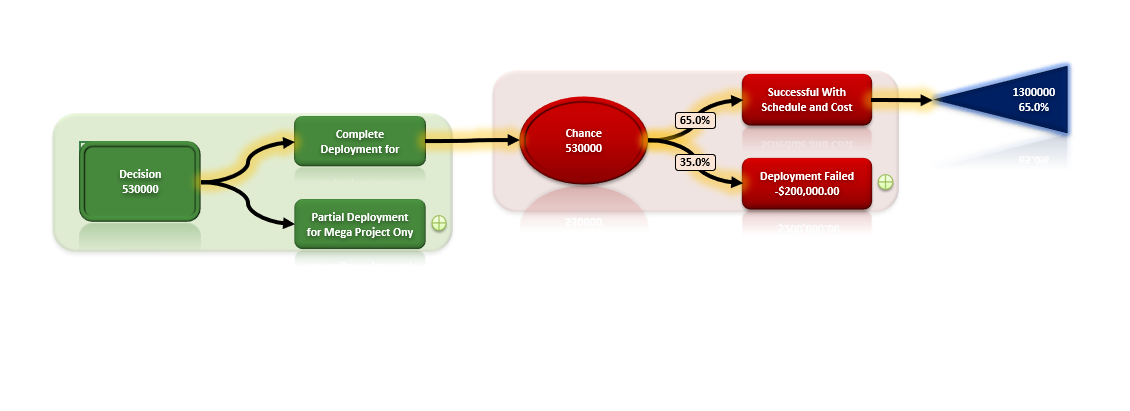
After several meetings and brainstorming sessions, developed “Decision Tree” with associated cost and monetary benefits. A data table is given below:
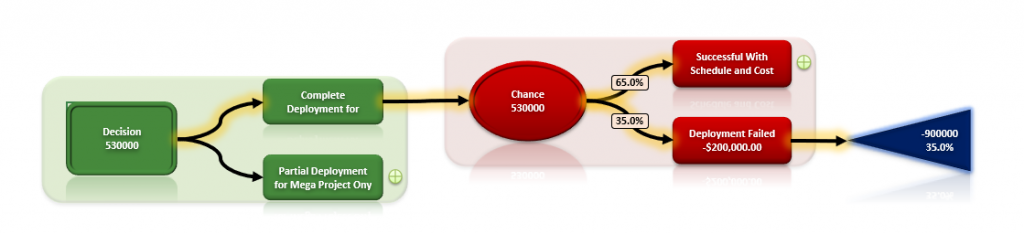
Cost of Complete Deployment for Enterprise Project Management was $700K. A 65 % probability to save (benefit) $2 M in case of successful deployment and meeting objectives. 35% probability of losses. The losses that would be $200k in case of delays, resistance from the stakeholder for change and interruptions because of low productivity.
More risk-averse approach to deploying and implement the software for megaproject only i.e. Partial Deployment. Cost of Partial Deployment was $350K. Probability of success was 70% with cost-saving of $ 1 M while the probability of failure was30% with a loss of $ 100k.
Pic 1 - Decision Tree with Chance Nodes
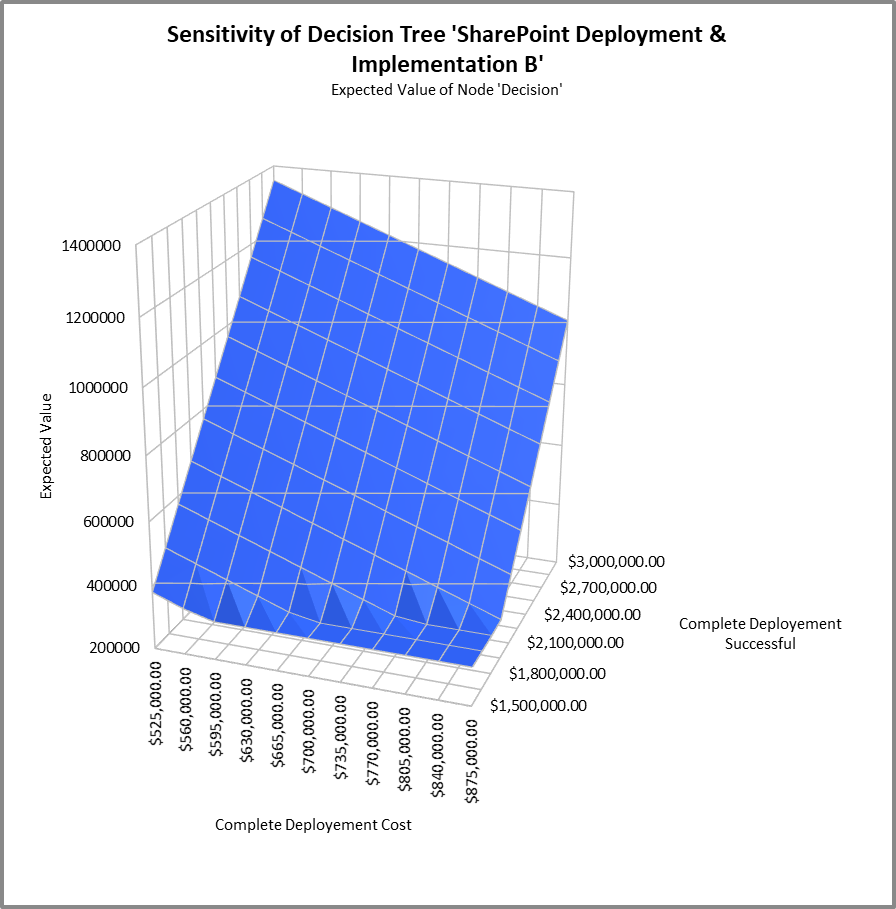
2 -way sensitivity 3-D graph shows a combination of two (2) inputs and the corresponding output. Choose two inputs to display corresponding output values i.e. Expected Values.
Graph 1 - Two Way Sensitivity Graph
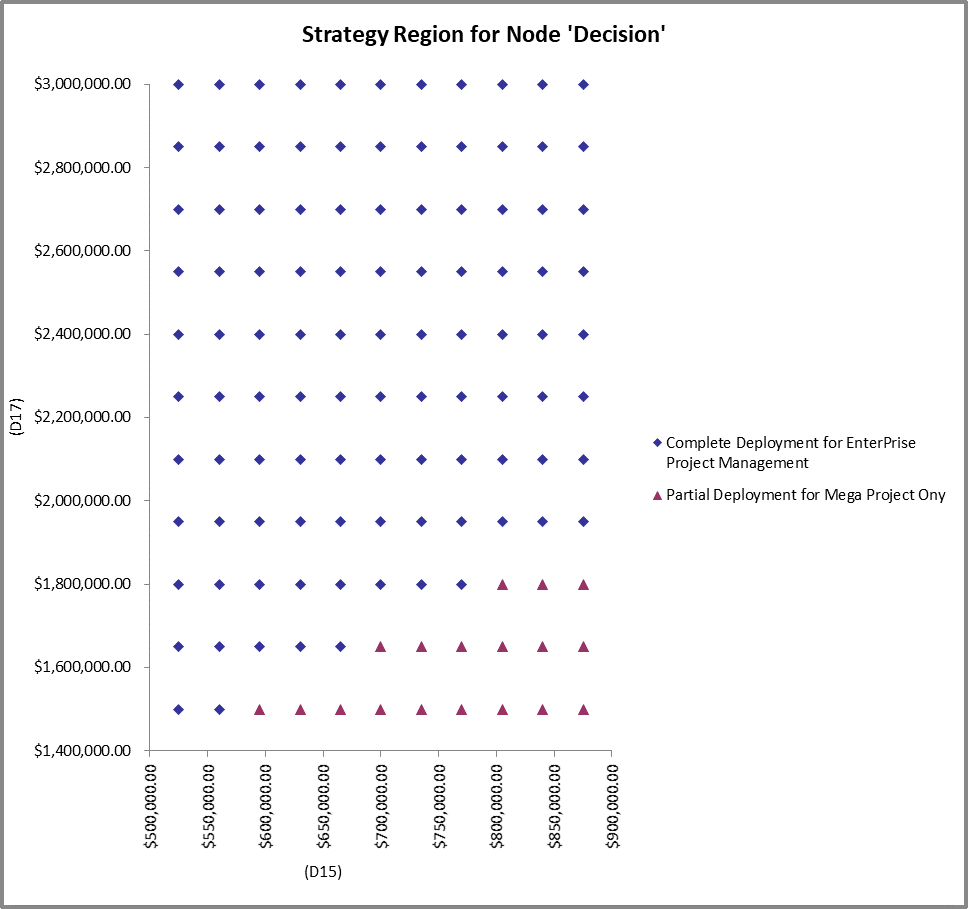
Strategy Region Graph is used to portray the best decision for the combination of the two inputs. Diamond Shaped icon is used to display the corresponding combination. It provides headway to choose option precisely based on data.
Graph 2 - Strategy Region Graph
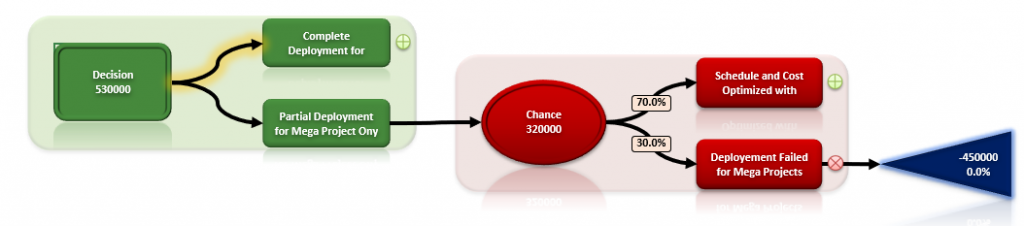
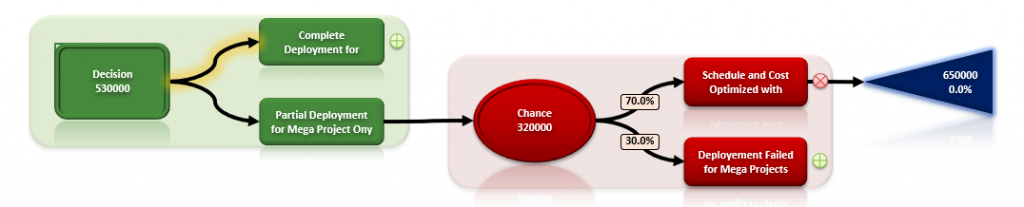
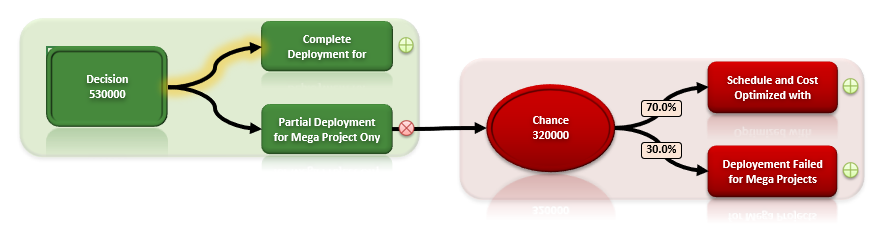
Big Picture:
Big Picture portrays Decision Tree in a dynamic way. Eye-catching graphics help to visually illustrate the various components of the complex Decision Tree. It helps to present an idea to the management in an interactive way. Below given Big Pictures are showing the complete Decision Tree in fragments. It provides a framework to analyze various options critically for digital risk management.
Conclusion - Decisive Decision Making
After presenting data in a structured and graphical way, the Board approved the project with one condition. The condition was to implement the project in phases:
1- In the first phase deploy software partially for mega-projects only.
2- In the second phase deploy the complete project and align overall project scope.
Decision Making requires Critical Thinking and aligning data to Project scope statement. It helps to collect, reshape and align data to address actual problem and make the right decision in digital risk management!