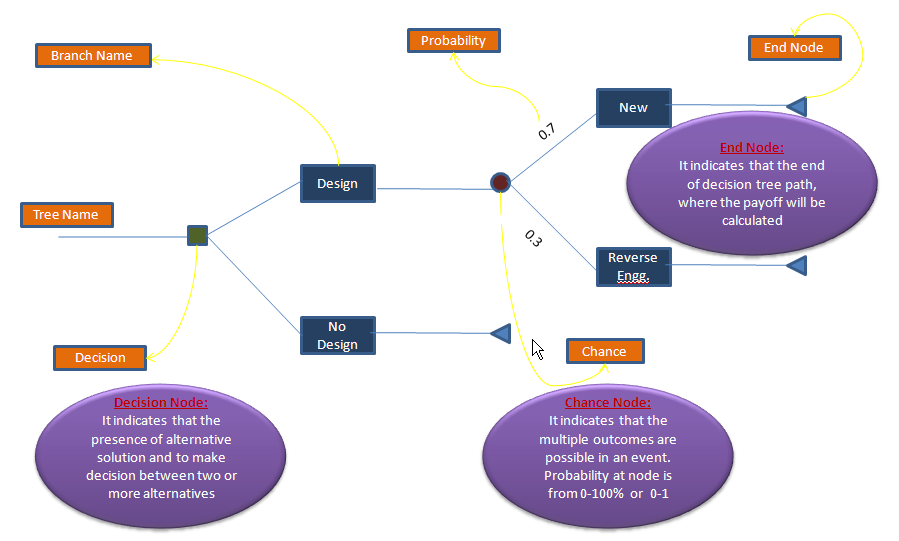
Development of Decision Tree:
After thorough analysis, there were five proposed options to choose the optimum one. Options were:
- Complete Product Development along with Sales and Marketing
- Product Design
- Prototyping
- Production
- Sales and Marketing
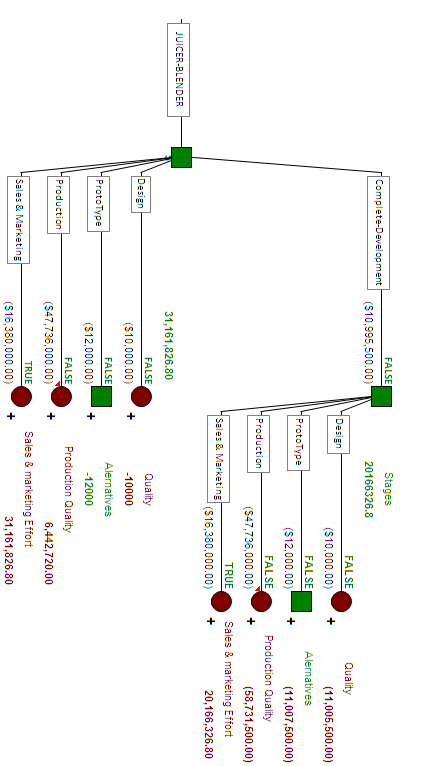
Solution one was a complete product development from product initialization to sales and marketing. Other options were product design, prototyping, production and Sales and Marketing respectively. The goal was to get maximum profit by spending less capital while catering other internal and external Constraints as described in the last paragraph of section-4. Collapsed Decision Tree is illustrated in figure 4.
Incomplete product development, a risk of financial loss was greater because of substantial capital as well as production costs.

Figure-4: Development of Decision Tree

Figure-5: Complete Illustrated Decision Tree
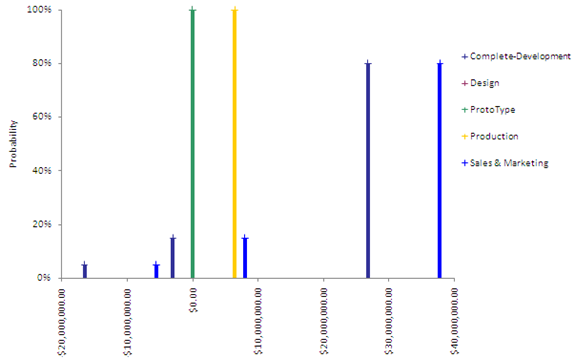
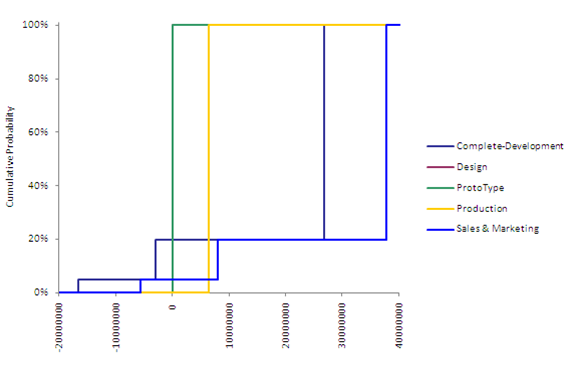
Outcome of Decision Tree:
After analyzing Decision Tree got the following results. Table -2 illustrates Arrival Probability (This is the probability that this decision encountered, assuming you followed all the optimal choices.) and Benefit of Correct choice (This is the difference of expected values between the optimal choice and the worst choice for this decision.).