Digital Risk Analysis using Monte Carlo Simulation using Monte Carlo Simulation (MCS)
Questions:
What is Digital Risk Management?
Why Schedule for Agile environment?
How Monte Carlos Simulation will help to answer the question and concerns of key stakeholders.
Digital World:
Digital electronics provides the basis for fourth industrial revolution or second (2nd) machine age. It is evolving and following “Morse Law” and expanding exponentially. Computing power is also growing substantially to provide support in planning, designing, and producing new innovative products either virtually or physically.
The combined power of digital electronics (digital) and computing are leading to lively recombinant innovations that are reshaping the business. Word. More and more tech. Companies are securing a place in the Combined power of digital electronics (digital) and computing are leading to lively recombinant innovations that are reshaping the business world. More and more tech. companies are securing a place in the top 100 among fortune 500 companies.
Even the integration of virtual (data, data analytics, AI, VR, AR, neural networks) and physical products (robots, drones, 3D printers) is increasing leading to solving very complex problems which were not possible earlier.
One this is common in digital project that is coding. Scrum, Agile and Kanban are very much integrated for progressive elaboration and developing software development project. Although agility is a major concept in IT project management, but still waterfall with gating review is predominant for program management. Some how for digital projects, interfacing is challenging and require following schedule and cost estimating best practices to avoid pitfalls during execution to avoid program failure.
Digital Schedule:
Whether it is waterfall or agile project management, project schedule is utmost to plan and tack project activities. The Agile project schedule is required to be developed to portray incremental and iterative activities. Define short development please in schedule, i.e., Sprint. Sprint is defined by the available time “time-boxed” and resources. It will help planner/scheduler to estimate time and cost simultaneously. Velocity helps to measure work completed, planned vs actual, during single Phase or sprint.
Project schedule drives the project execution. The project often slips their schedules. Schedule delay, for whatever reason, is resulting in losing monetary benefits, unsatisfied management and losing the opportunity to gain potential market share. A delay in executing a single “Story” can cause financial and reputational loss. After creating the schedule, reviewing the schedule with project management team (PMT) is helpful to identify and correct any schedule error.
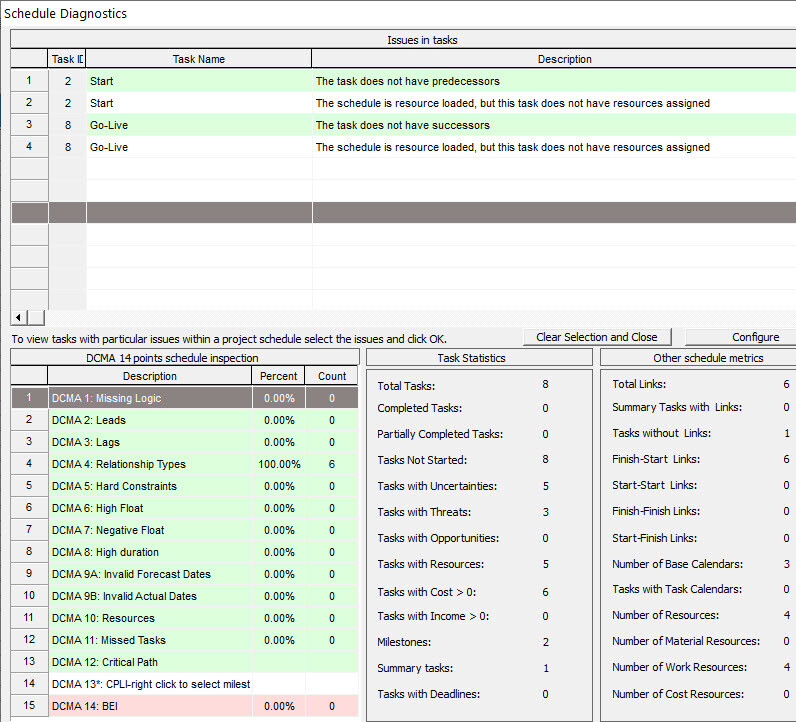
It’s best industrial practice to perform project schedule diagnostics. Dissection of schedule using DCMA 14 points schedule inspection criteria is providing schedule’s complete picture. It helps to highlight grey areas and provides recombination for corrective actions. Schedule diagnostics are given below:
Pic 1 - Schedule Diagnostics as per 14 - Point Assessment
Quantitative Schedule Risk Analysis (QSRA):
For Quantitative Schedule Risk Analysis (QSRA), need project schedule that presents all necessary activities with resource allocation. Apply activity uncertainty and link risks to an activity. That is enough?
Certainly not. Completeness and proper activity linkage are important for performing Monte Carlo Simulation. It’s best industrial practice to perform project schedule diagnostics.
A Quantitative Schedule Risk Analysis (QSRA) uses a probability distribution to run Monte Carlo simulation using key risks to activities. A QSRA is a combination of critical path method (CPM) schedule, risks from risk register and linking risks to activities (risk driver) and statistical distribution to analyze data and predict level of confidence in meeting project’s completion date and duration. It helps to calculate schedule contingency.
Level 1 schedule contains major milestones and the level of uncertainty in estimating schedule duration is high. The Level-1 schedule is developed based on past experiences and Heuristics assumptions that can be higher or lower, i.e., uncertainty as lack of information or complete picture. Therefore, sensitivity analysis helps to identify the key activities or risks contributing to project delay.
The focus of analysis is on but not limited to:
Uncertainty and risk impact to an activity and overall project duration and finish time.
What-if schedule will delay by one (1) week or one (1) month?
Cost is the main driver for making decisions. It’s the key factor that makes the management happy or unhappy. Business is all about monetary benefits. Class 5 cost estimate is developed during project initiation. Typical ranges for Class 5 cost estimate as per AACE can be ± 50% or ±100%. Uncertainty is high and confidence level is low. Therefore, it is necessary to consider all fixed and variable costs including overheads. Apply uncertainty and risk to model cost using probability distribution.
Integrated Cost schedule Risk Analysis (IRA):
In Integrated cost, schedule risk analysis, schedule is developed with time-phased cost to analyze the combine effect of risk on schedule and cost simultaneously. After running the simulation, joint confidence level for cost and schedule can be presented for decision making and specifying contingency for both schedule and cost.
Digital Risk Management:
Risk management, especially the quantitative risk analysis is missing part in software project development. More focus on reactive approach that is issue and incident management than a proactive approach risk management. In recent days, as technology evolving and companies are transitioning to digital world, i.e. It’s essential to perform quantitative risk management for digital transformation. Throughout the software development life cycle (SDLC). There are many sources of uncertainties and risks that can lead to schedule delays and cost overrun.
Pic 2 - Digital Risk Management Mind Map
Case Study
There can be many apparent or hidden sources of risks like, bleeding edge technology, hardware, obsolete technology, technology interfacing, inadequate resources, software configuration, security issues, patches, and digital platforms etc.
Digital project Case study:
Project schedule (level 1) is given below:
S. No.
Schedule
Duration
1
Planning
10
2
Development
20
3
Testing & Quality Assurance
15
4
Production Development
12
5
Validation
5
6
Go-live
0
Time-phased cost has allocated to the activities. Resources are estimated as follows:
S. No.
Schedule
Unit (%)
Rate /hr ($)
1
Project Manager
100 %
$ 80
2
Developers
300 %
$ 60
3
Testing Team
400 %
$ 40
4
PMT
400 %
$ 50
.
Uncertainties are calculated as per expert judgement and similar project experience:
S. No.
Schedule
Min. Duration
Mean Duration
Max. Duration
1
Planning
90 %
100 %
150 %
2
Development
90 %
100 %
150 %
3
Testing & Quality Assurance
90 %
100 %
150 %
4
Production Development
90 %
100 %
150 %
5
Validation
90 %
100 %
150 %
6
Go-live
0
0
0
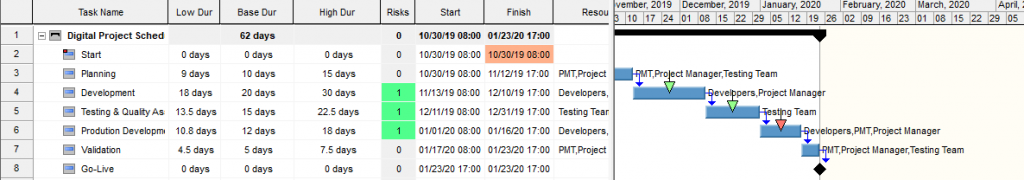
Pic 3 - Project Schedule with Uncertainties
Analyzing different scenarios provide alternative to make a decision. Schedule with Uncertainties. Elaborate Uncertainty and Risk with respect to different standards or guidelines will help to understand these two terms. Also, need to understand the relationship between these two terms.
According to the PMI Practice Standard for Project Risk Management:
A risk is an uncertain event or condition, if it occurs, has a positive or negative effect on a project’s objectives.
According to ISO 73:2009: 1.1 Risk
Effect of Uncertainties on Objectives
Note: 5 – Uncertainty is the state, even partial, of deficiency of information related to, understanding or knowledge of, an event, its consequence, or likelihood.
Uncertainty can be known – Known (e.g., During holidays there will be a low worker’s productivity). Know unknown, know the uncertainty, but the impact is unknown (e.g. Periodic Union strikes during a month). Unknown – Unknown (e.g., flood, hurricane where it is difficult to predict the exact timing and overall impact.).
Example:
Activity A – Duration 10 Days
Activity B – Duration 5 Days
Activity C – Duration 12 Days
These are the estimated values. The question is, what-if a required resource will not be available for three (3) days? To cater to these uncertainties, three-point estimates are being used, i.e. Optimistic, Most Likely and Pessimistic. The uncertainty should not be heuristics. Assumptions made should be validated.
Also, currency rate fluctuation and raw material prices are a good example of uncertainty.
Risk is a product of probability X impact, i.e., P X I
Example:
Like late delivery of material at the site
or the Unavailability of a skilled worker.
Risk must be defined by using Risk meta language, i.e., Cause – Risk – Impact
Because of many concurrent projects in an area (cause), Skilled worker might not be available (Risk) leading to schedule delays, cost impact, and poor quality (effect or impact)
Project Risks
Risk identification in the early stage of project is important. It is very important to link only relevant risks to project schedule and cost. A list of five (5) identified risks are:
Pic 4 - project Risks
In quantitative analysis, the impact is a calculated value based on how it effects different project parameters such as schedule, finish time, cost etc. and is not equal to the input impacts. The underlying methodology used for calculating both impact and scores is based on sensitivity analysis using Spearman Rank Order correlation coefficients. When scores or impacts are below 1%, they are often rounded down to 0. In practical terms, it means that the three risks have only an extremely small impact on your project schedule [1].
Results After Monte Carlo Simulation
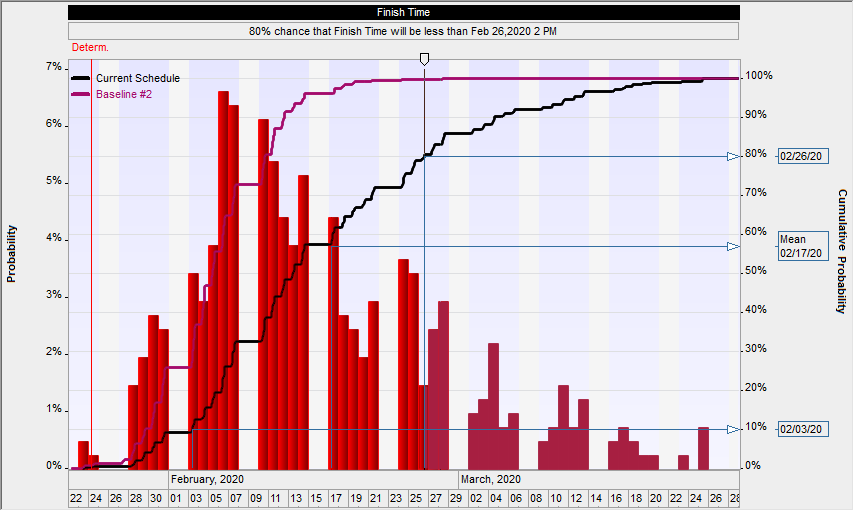
Pic 5 - Baseline Comparison, Current Schedule Baseline with Uncertainties and Risk
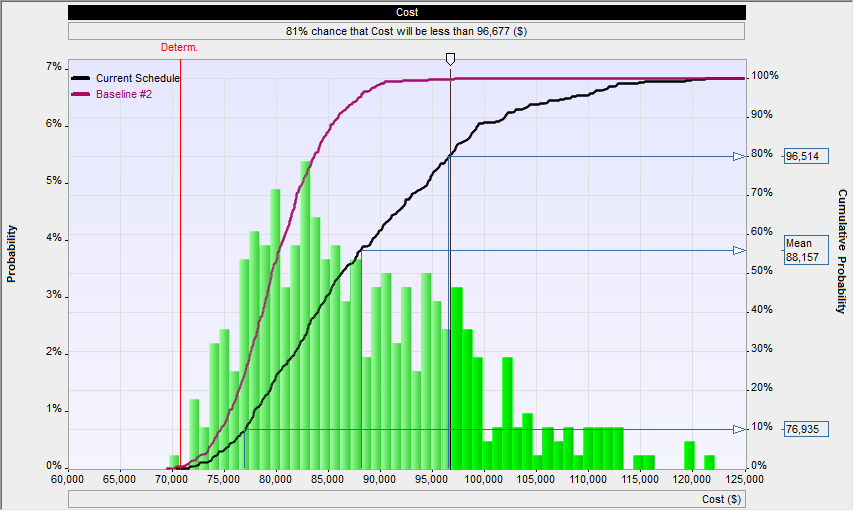
Pic 6 - Cost Baselines Comparisons - Current Schedule Baseline with Uncertainties and Risk
Pic 7 - Joint Confidence Level (JCL), Cost and Schedule
Pic 8 - Simulation Overall Result Comparisons
Conclusion:
Monte Carlo simulation helps to specify schedule and cost contingencies. Percentage (%) allocation of cost contingency is varied industry to industry. Rule of thumb is 10%. However, between 10 % to 20% is usually considered. 50% chance is taking as an actual schedule completion date. 80% is taking as contingency reserves. 80% to 100% is taken as management reserves.
It is important that specify mitigation actions and try to avoid risk or mitigate the risk by making changes in schedule, cost and other estimates.
Schedule and cost baselines should not be defined without risk analysis.