
This article is on the RISK Register. It is equally applicable to Portfolios, programs, projects, ERM, etc.
Throughout the article for simplicity, Risk Register is referred to Projects only.
Key Words
Risk identification, Risk communication, risk assessment, risk evaluation, risk meta-language, Qualitative Risk Analysis, Risk , Causes, Causation, Schedule, Cost, quality, Risk score, probability, safety, Risk Matrix, Heat map, High risk, Medium risk, Low Risk, Green Risk, Red Risk, Yellow Risk, Risk Appetite, PMI, ISO 31000, ISO 31000, Bayesian Belief Network (BBN), Bayesian theorem, Risk Tolerance, Risk Audit, Risk Controls, Threat, Opportunity, Avoid, Mitigate, Transfer, , Avoid, Share, Enhance, Exploit, Risk management plan, Dashboard, Data, Analytics, Risk Complexity, Internal Factors, External factors, Qualitative, Quantitative, Taxonomy, RBS, WBS, Project Phase, PESTLE, TECOP, Risk communication, Risk Register Traceability Matrix. Risk Exposure, , Cost estimate, Watchlist, Secondary Risk
New Terminology
Risk Register Traceability Matrix: who provides the information, when and why related information is stored in which location, like the Bayesian Belief Network diagram and Causal Loop Diagram (CLD) to understand the risk as a whole.
Summary
The Risk Register or Risk Log is a repository to record, analyze, and store risk data.
According to IRM’s A Risk Practitioners Guide to ISO 31000: 2018:
“The nature and extent of communication of the information contained in the risk register throughout the risk architecture of the organization also help define the risk management context.”
The Risk Register serves as an essential, scaled document designed to effectively communicate the nuances of risk to all relevant stakeholders. It encapsulates critical information necessary for a comprehensive risk assessment and facilitates a bi-directional flow of information among stakeholders. Senior management leverages the register to gain insights into the overall project risk profile and to assess key performance indicators, which are crucial for gauging the project’s health.
Achieving this clarity is the result of synthesizing disparate data points and presenting them in the form of interactive, easily interpretable charts. By prioritizing risk analytics, the organization can quantify, assess, and project potential uncertainties. Such proactive measures are particularly vital for navigating the complexities of global expansion and the emerging challenges associated with the Fourth Industrial Revolution, or the Second Machine Age.
In the face of digital transformation, overcoming the obstacles presented by digitization is imperative. Enhancing risk visibility through the strategic use of infographics within the Risk Register can serve as a transformative tool for decision-makers.
Watch my webinar’s recording:
https://go.palisade.com/WBN2020-08-14CapitalProjectPetrochemical.html
Risk Register
The Risk register or Risk log is a repository to collect, analyze, visualize risk-related information. It is a document, helpful to communicate and provide information from top executives to bottom level workers. It is a constituent part of a risk management plan, created during project initiation and keep on updated during the complete project life cycle. Even it remains “live” after handing over the project to the operations team.
Watch:https://www.gleeym.com/2020/07/15/riskrdoodle/
Why create a risk register is a frequently asked question. The basic two answers are:
Risk is an uncertain condition or event that is required to be captured to assess them.
The risk register is a tool to provide a holistic picture of project health. It is a tool to communicate flawlessly from top to bottom.
Creating a risk register is a kick-start to execute risk management activities. Project project-tailored risk register helps to assess risk effectively. It doesn’t matter whether to use or follow any specific template. Only matter the way to capture the risks. Distinguish between risks and day-to-day activities. Capture known–known, Known -Unknown and Unknown – Unknown risks.
Follow PACED [1] while creating a risk register. Although PACED is specific to risk management processes, but it is equally applicable to each individual risk process or relevant documents too. What is PACED? PACED is:
P – Proportionate
A – Aligned
C – Comprehensive
E – Embedded
D – Dynamic

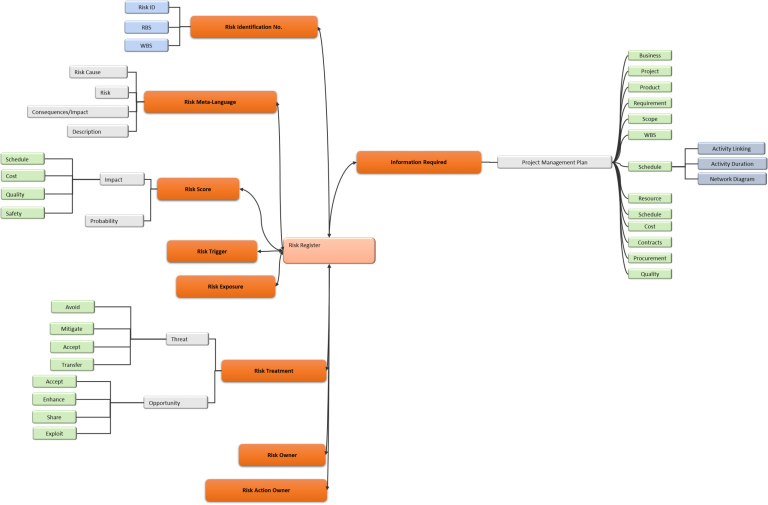
A simplified Mind map is given below to illustrate the risk register components. Risk register encapsulates risk appetite and risk tolerance while risk assessment. Risk assessment is:
- Risk Identification
- Risk Analysis
- Risk Evaluation
The risk register can’t be created and updated in isolation. Schedule and cost estimates along with other project documents provide input to risk register for value creation. Without schedule and input document it is likely to have misleading risks leading to more turmoil.
Risk Breakdown Structure (RBS) or Risk categorization is helpful to provide a foundation for risk identification. Shell’s Technology, Economical, Commercial, Operational and Political (TECOP) benefits to define and align levels and sub-levels of RBS. A PESTEL analysis (formerly known as PEST analysis) is a framework or tool used to define RBS categories and subcategories. Either approach may have a profound impact on an overall risk management process.
Risk categorization or classification is a better approach to capture risks related to all business areas. It’s a consistent approach for value proposition to risk management. Defining and formalizing Key Risk Indicators (KRI) and utilizing the same categories for risk categorization will add value for achieving strategic goals. High-level risk register mind map is given below:
Risk Register Road Map
The Risk register journey starts even before project initiation. Tailoring (adapting) the risk register to project size and complexity helps to estimate resources requirement, a balanced approach, for project risk management. Risk register Road Map or Timeline is interesting and vivid:

Case Study – Development of Risk Register with Dashboard
The Risk register journey starts even before project initiation. Tailoring (adapting) the risk register to project size and complexity helps to estimate resource requirements, a balanced approach, for project risk management. The risk register Road Map or Timeline is interesting and vivid:
The Risk Register, a risk log, provides information and the best way to communicate from top management to supervisors and even to workers. A pervasive document to align the resources for achieving one goal i.e. enhance opportunities and reduce threats.
Stakeholders, especially the top executives don’t want to be lost in the Jungle of information. They want well-articulated data in the shape of charts, and a dashboard.
Therefore, develop a risk register to cater to the requirements of the risk owner to the executive. With the clear concept to provide consistent, flawless, and more importantly same information, but tailored information. All information is not for everyone.
Deming’s Plan–Do–Check–Act (PDCA) cycle is a simple, but powerful way to create documents and satisfy the requirements of a quality management system. Follow PDCA for developing risk register.

Risk Identification
The Risk Identification number can be the combination of WBS, RBS, or risk categorization and Risk No. After defining the risk identification, defining risk is a major and foremost important task. Defining risk requires following Risk Meta – Language i.e.
Cause(s) – Risk – Effect
Because of (Cause) Risk may occur leading to schedule overrun (effect)
Risk Example. Put the unavailability of Skilled Workers as an example.
Cause: Because of so many projects in an area
Risk: Unavailability of skilled labor during construction
Impact: Leading to schedule delay and cost impact
Is it complete information? Does it provide detailed insight into the risk? The answer is no. It is impossible to capture complete information related to risk in the risk register. That is the reason sometimes it is hard and time-consuming to understand the risk context.

One way to tackle this issue is to provide a risk description i.e. a brief background. However, introducing the Risk Traceability Matrix Register (RTMR, a new concept) to track the complete risk data will provide the complete log of each risk. It will also help to record the location of extra or detailed information (either physically or electronically) and tag data with proper identification codes. Furthermore, it will become a part of risk achieving and lessons learned.
Qualitative Risk Analysis
Qualitative risk analysis is done in the risk register to prioritize risks., but all related information like schedule impact estimate and cost impact should be captured. This information must not be heuristics, P6/MSP schedule or cost estimates provide input information. Store data in numbers to perform semi-qualitative risk analysis in the risk register as per requirement.
Based on the judgment or expert opinion, specify the probability of a risk. The Bayesian theorem can be the best alternative to avoid heuristics. Bayesian Belief Network (BBN) is the best way to create causation and find out posterior probability.
Risk Impact or consequences categories are often schedule, cost, quality, and HSE, but not limited to. In this era of digitization, cybersecurity, politics, organizational reputation, and change management can also be the major impact categories.
Probability and impact analysis are done by using the risk matrix or heat map. A sample risk matrix is given below:

Risk score is calculated by using following formula:
Risk Score = Probability X Impact
Risk score is also called as Expected Monitory Value (EMV)

Risk Evaluation
In case of threat (negative impact), there are four options available to reduce impact:
- Accept
- Avoid
- Mitigate
- Transfer
Either one of them or a combination of these options can be used to treat risk. Although practically there is no significance. However, it is required to specify response actions with target dates and proper “Risk Action owner”. The risk owner can be the Risk action owner, but usually, it is a person who implements the actions. Response action must be “SMART”. SMART is:

For opportunities (positive impact), there are four options available to enhance the impact:
- Accept
- Enhance
- Exploit
- Share
Risk response actions are defined as high and medium risks. While green risks are kept alive in the risk register as a “Watchlist”.
There can be a secondary risk in the case of a transfer option. Therefore, it is required to keep an eye on associated risks too.
Risk Audit
Risk audit should be carried at after a regular frequency as per the risk management plan for major and medium risks. For major risks, it is a suggestion, or option, to sign off the risk before risk closure like HAZOP.
Risk audit helps to measure the risk efficacy and trends over the period. It will identify pitfalls in the process and suggest process improvement initiatives.
Risk Health Indicators – Dashboard
A risk audit should be conducted at regular intervals in accordance with the risk management plan, particularly for major and medium risks. For significant risks, it is advisable to consider signing off on the risk prior to its closure, akin to the HAZOP methodology.
The purpose of a risk audit is to evaluate the effectiveness of risk management and to track trends over time. Its aim is to identify weaknesses within the current process and to recommend initiatives for process improvement.
A frequently asked question is whether a project is inherently risky. Determining the risk level of a project also influences the risk management approach at the project or program level. If a project is sizable and utilizes a considerable amount of organizational resources, it may be classified as complex and risky. The challenge lies in defining the complexity and the overall risk of the project.
To address this, one must consider both internal and external factors and assign a risk score accordingly. By integrating these three (3) elements—the risk score, the internal and external factors—a comprehensive assessment of the overall project risk can be achieved. A well-crafted questionnaire, informed by expert opinions and interviews with key stakeholders, can facilitate this process. It is crucial to scale the risk management efforts in proportion to the project complexity. The system for measuring risk should align with the risk register to accurately reflect project complexity. A mere tally of high “Red” risks is not sufficient to characterize the overall project risk.
GleeYM has developed a risk register that quantifies the overall project risk. Converting data, including textual information, into charts is essential to providing management with clear and concise information indicative of the project’s health. Key Performance Indicators (KPIs) are necessary to detail the overall project risk. The indicators for assessing Project Risk Health are as follows:

Conclusion

References
1- A Risk Practitioners Guide to ISO 31000: 2018 by IRM
2- Practice Standard for Risk Management By PMI
Thank you
PALISADE @RISK
Softvative Inc.