A schedule risk analysis (SRA) uses a risk-based project schedule (derived from the master schedule) to apply statistical techniques to envisage a level of confidence in meeting a project’s completion date. This analysis focuses on uncertainty they affect the schedule overall and activities durations and completion date. SRA starts with reviewing the project schedule and performing schedule quality checks as specified by DCMA 14-points. A sequence of activities and activities relationship plays an important role to avoid “Garbage in and Garbage out”.
Project Schedule Quality Check for Schedule Risk Analysis:
There can be several other parameters that can contribute to quality SRA. Like:
Contain all the activities that are necessary for the SRA.
Keep in mind there is a difference between “Master Schedule” and Schedule for risk analysis.
All activities should be linked together.
The sequence of activities plays an important role. Improper sequence of activities is one of the causes of conflicts in major complex projects.
Get the buy-in from all the key stakeholders.
Specify the assumptions and analyze the assumption during the simulation.
Specify the uncertainties for each activity i.e. min. most likely and the max. Avoid heuristics estimates.
Try to get rid of “Cognitive Bias”. Although it is very difficult. Support from top executives may help.
Depending upon the level of schedule. It takes days or weeks or even months to develop a schedule. There is no magic to perform SRA and visualize the data in seconds. Need to perform SRA several times with different scenario to compare results.
Overlay results to analyze and visualize the difference between various output by varying the input data.
Uncertainties may cover lack of knowledge activity duration estimation error, resource availability, organisational culture, internal and external factors, market conditions, political scenario, project execution methodology, resource availability, productivity, project constraints, technology constraints, Biased opinion, known – Known and even unknown – unknown (This scenario should be analyzed separately to understand the impact) etc.
Perform quality checks on Schedule before Monte Carlo simulation as per DCMA 14-points may be a good choice for quality checks. Few points are given below
Activity logic
Leads and Lags: Schedule must be not containing any activity with leads and lags. Decompose the activity into two activities to avoid leads and lags.
Check activity relationships. Avoid Hard constraints.
Avoid high floats in the schedule. Also, if there is any negative float then fix it up.
Check other DCMA’s constraints as per project nature and schedule level.
Schedule Risk Analysis (SRA):
Schedule risk analysis (SRA) helps to analyze the uncertainty in the project schedule using Monte Carlo Simulation. Deterministic schedule duration and finish date don’t provide enough information to answer flowing questions:
What is the probability of completing the project on the target date?
What if the predecessor of an activity finishes late?
What is the eighty (90%) chance of finishing the project?
SCR scope is:
Schedule Risk Analysis (SRA) to analyze uncertainty
Correlating the activities
Probabilistic Branching
List of Activities:
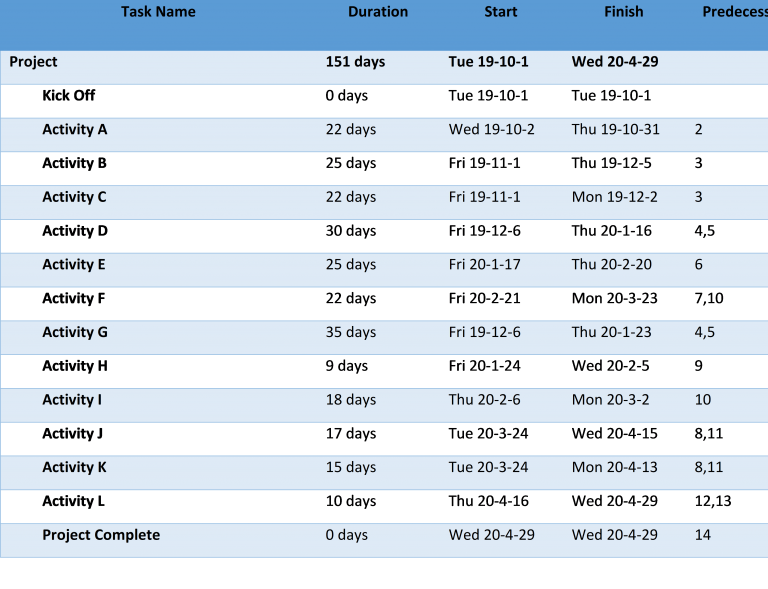
List of activities are given below with duration and predecessors
Picture 1 - List of Activities
Parameter Entry Table:
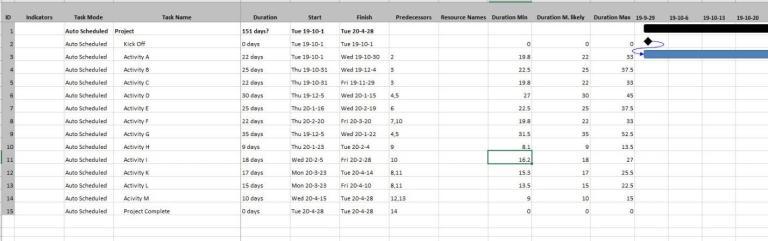
Parameter Entry Table is created for 3-Point estimates collected after a brainstorming session with the Subject Matter Experts (SME). Collect data is also benchmarked with archives available for similar-sized projects within the organization. Chain-of-causes is a good approach to understand the various factors contributing to uncertainty in the activity. Another development is using the Casual Loop Diagram (CLD). It helps not only to identify the key variables but to draw a relationship between cause and effect. Another methodology is Mind mapping. Mind Mapping helping to analyze the problem by lining the different variables.
Picture 2 - Parameter Entry Table
Parameter Entry Table is shown above with min. most likely and max. values. Most likely is the schedule actual duration. For this article, optimistic value is adjusted to 10% of the most likely value. While Pessimistic value is 50% of the most likely value. For 3 points estimates either use PERT or Triangular distribution. The triangular distribution is the best choice to have positively skewed data with wider distribution of data.
Simulation and Results:
Run the Monte Carlo Simulation (MCS) for SRA. There is a 90% chance that the project will finish before June 18th, 2020. Surprisingly, there is only less than a 5% chance to complete the project on the target date. Why there are shoulders in the output graph? It is because the project calendar is set to five (5) working days. It is representing off days.
Results are:
Picture 2 - SRA - 5 Days Calendar
What if to simulate project risk analysis for a project schedule with seven (7) days working calendars? It depends on the project nature. Usually, construction projects, commissioning and outages are following seven (7) working days calendar.
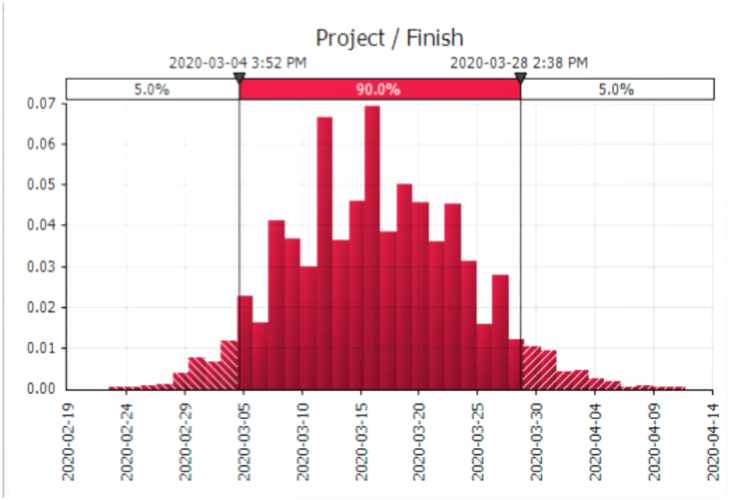
In the case of seven (7) working days calendar the project target finish date is Feb 23, 2020. results are:
Picture 3 - SRA - 7 Days Calendar
Again, there is less than a 5% chance to meet the target date. There is a 90% chance that the target date will be close to Mar 30, 2020.
Correlation:
Correlation is required for Schedule Risk Analysis to avoid merged biased because of parallel paths along with critical Path (CP) i.e. near Critical paths. During a simulation, these paths merged together resulting shorter project completion duration. A risk driver is an approach to deal with it. However, another approach is to correlate related activities. correlating related activities results in wider distribution. Keep in mind activities in parallel or in series also play an important role in simulation and results.
Picture 4- SRA - Activities Correlated
There is a 90% chance that the target date will be Mar 30, 2020. Almost seven (7) days of difference between SRA with activities correlated and without correlation.
Probabilistic Branching:
Probabilistic branching is useful to analyze the scenarios within schedule during Scheduling Risk Analysis (SRA). For this project, there are two branches and executed simultaneously. The interesting part is that one Probabilistic branch lies in the Critical path (CP) while other path lies in a near-critical path.
Probabilistic branches are:
Activity B – Activity D – Activity E – Activity F
Activity C – Activity G -Activity H – Activity I
Results are:
Picture 5- SRA - 2 Probabilistic Branching
Results are negatively skewed. It is because of various reasons and one is having two branches in a schedule. Further analysis can be carried out like Sensitivity Analysis and Probabilistic Gantt chart to analyze the behavior of the activities.
Conclusion:
SRA is good for analyzing the project schedule statistically. Prior quality checks help to prepare schedule for a SRA. Running MCS, again and again, helps to analyze the various scenarios and compare results.